Monitor Azure Resources using Promitor
In this post I wanted to give a quick overview of Promitor, and the problems it’s solved for us at ResDiary.
What is Promitor
Promitor is a Prometheus Exporter that allows you to monitor your Azure resources, using the Azure Monitor API. Promitor functions like an adapter that pulls metric data from Azure, and then exposes that data in the Prometheus metric format.
What this means is that you can get Azure metrics into your Prometheus database, allowing you to graph those metrics in Grafana and alert on them just as you would with any other metrics.
Our journey
We first began the journey of trying to get Azure metrics into Prometheus about a year ago in March 2019. Initially we decided to use a project called Azure Metrics Exporter. Azure Metrics Exporter worked really well at getting us up and running very quickly, but unfortunately we found that it had a major performance bottleneck due to its design.
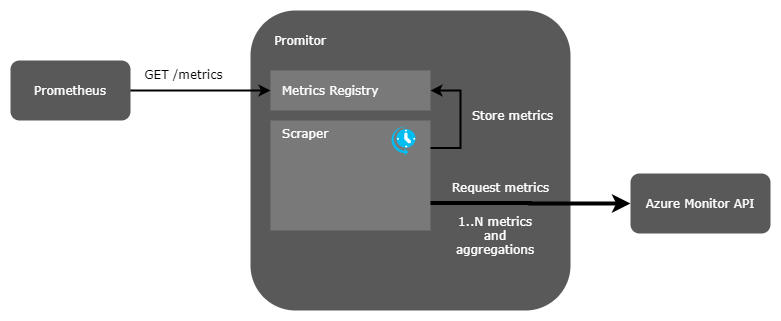
Azure Metrics Exporter makes a request to the Azure Monitor API each time Prometheus scrapes it for metrics. To make matters worse, the version we were using made an individual request to the Azure Monitor API for each individual resource and metric being scraped, as illustrated in the following diagram:

The problem with this approach is that requests to the Azure Monitor API can take
a significant amount of time, and the time taken to get all the metrics increases
relative to the number of resources being monitored. We found that after adding
around 12 resources to monitor, each with around 4 or 5 metrics and two aggregations,
Prometheus’s requests to the /metrics endpoint of the exporter were often timing
out, leading to missed scrapes (i.e. missing metric data).
Initially we tried reducing how often Prometheus scraped the exporter to every minute instead of every 30 seconds, and we increased the timeout for scrapes to every 45 seconds. The following graph shows when Prometheus scrapes to the exporter succeed or not. Success has a value of 1, and failure 0.

As you can see, before adjusting the frequency and timeouts for scrapes, we were experiencing around 6 failures an hour. After adjusting we reduced failures to around two an hour.
The nature of networking means that we expect to occasionally have requests that fail, but not at the frequency we were seeing. The following graph shows how the failed scrapes showed up as gaps in our Grafana graphs:
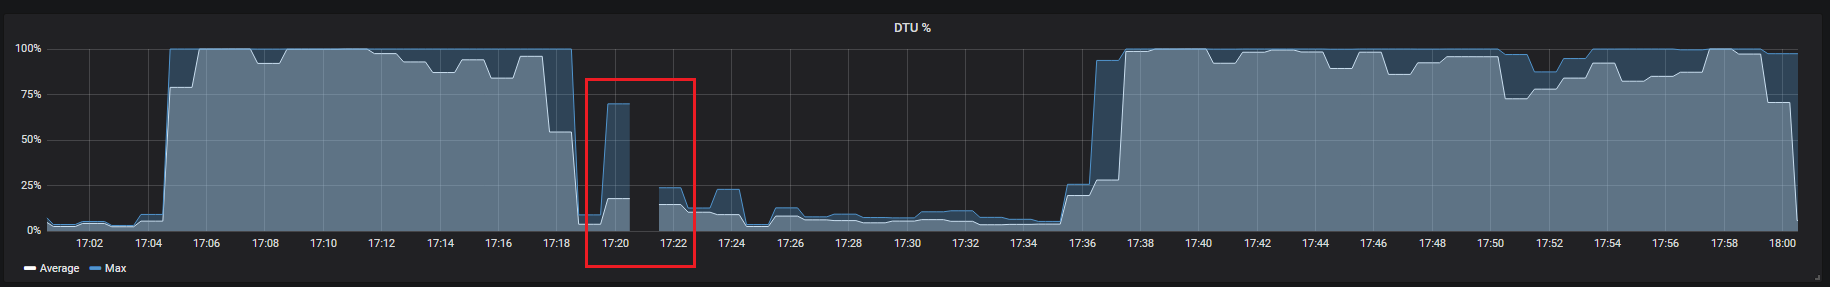
Perhaps even worse than that, failed scrapes could lead to false positives or negatives in our alerts!
At this point we realised that even after adjusting the scrape timeout, using Azure Metrics Exporter wasn’t going to be scalable. We maybe could have investigated splitting our metrics into groups, and running a separate instance of the exporter for each subset, but before doing that we decided to take another look to see what other options were available, and came across Promitor.
Promitor provides similar functionality to Azure Metrics Exporter, but differs significantly in its design. It takes the approach of gathering metrics data using background tasks that run on a configurable schedule, meaning that Prometheus scrapes are virtually instant, as illustrated in the following diagram:
Since switching to Promitor we have been able to add monitoring for as many of our Azure resources as we want without encountering any missed scrapes.
For the record I believe that improvements have been made to Azure Metrics Exporter since we stopped using it, so it’s possible that the performance has been improved or that this is no-longer a problem.
How we’re using Promitor
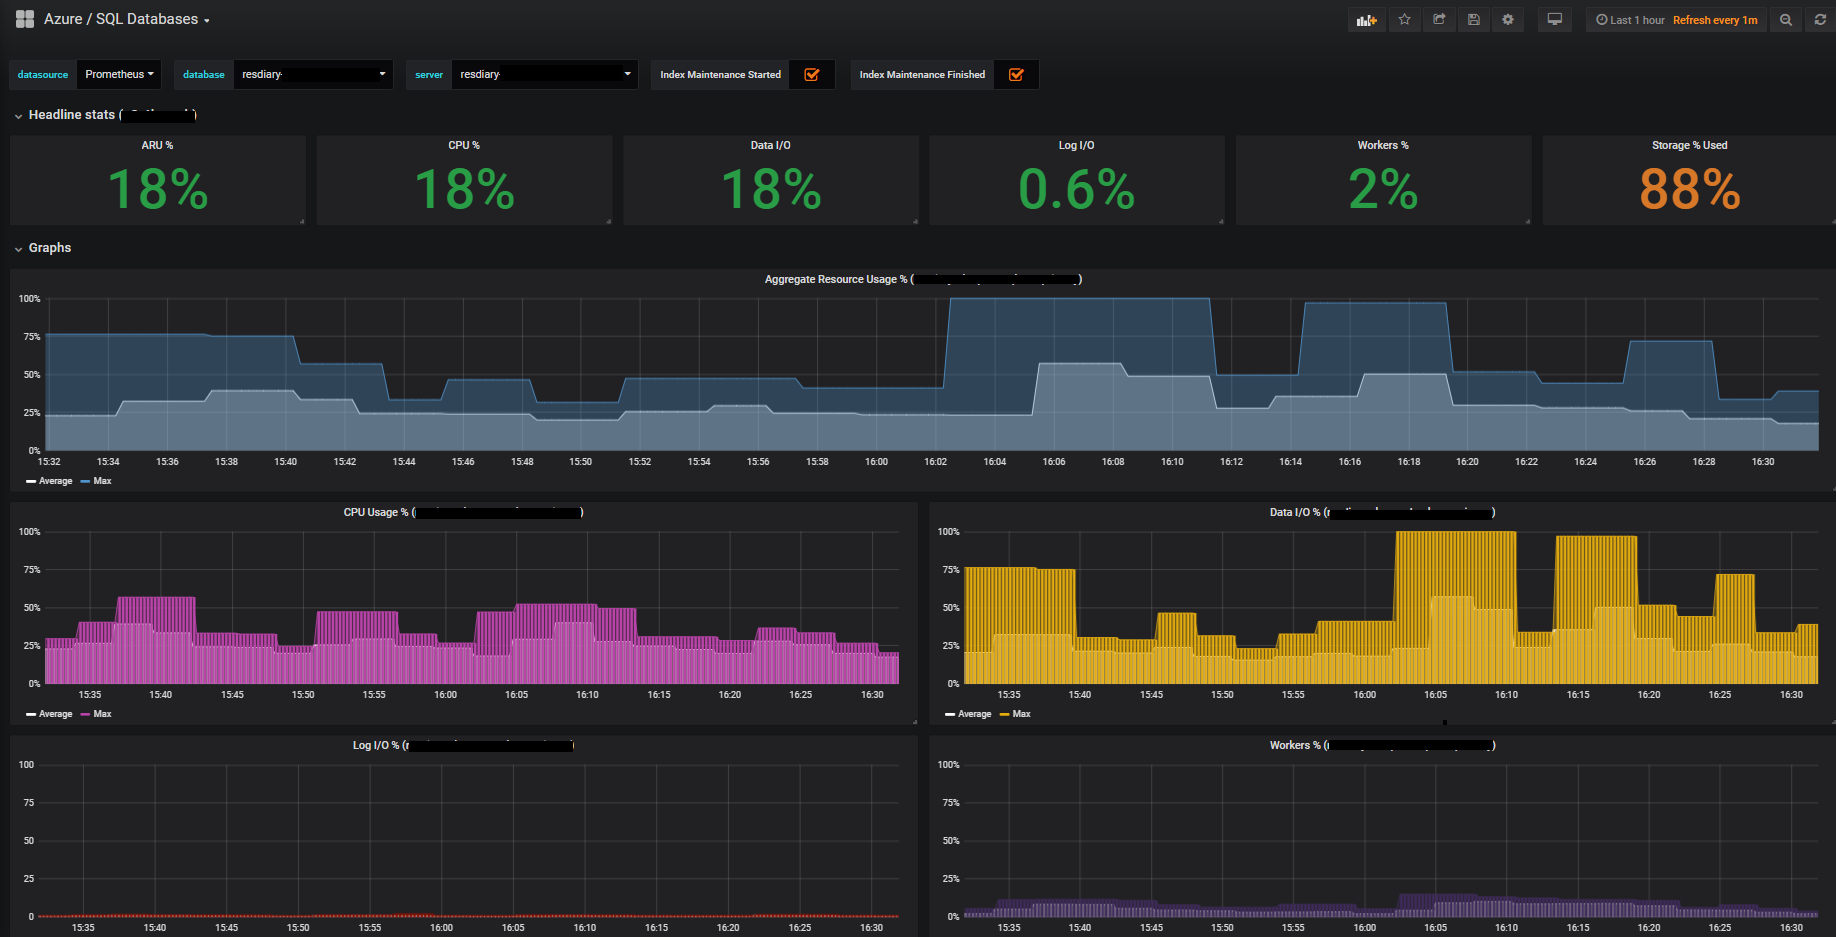
To give you an idea of how we’re using Promitor, the following screenshot shows an image of our SQL Database dashboard:
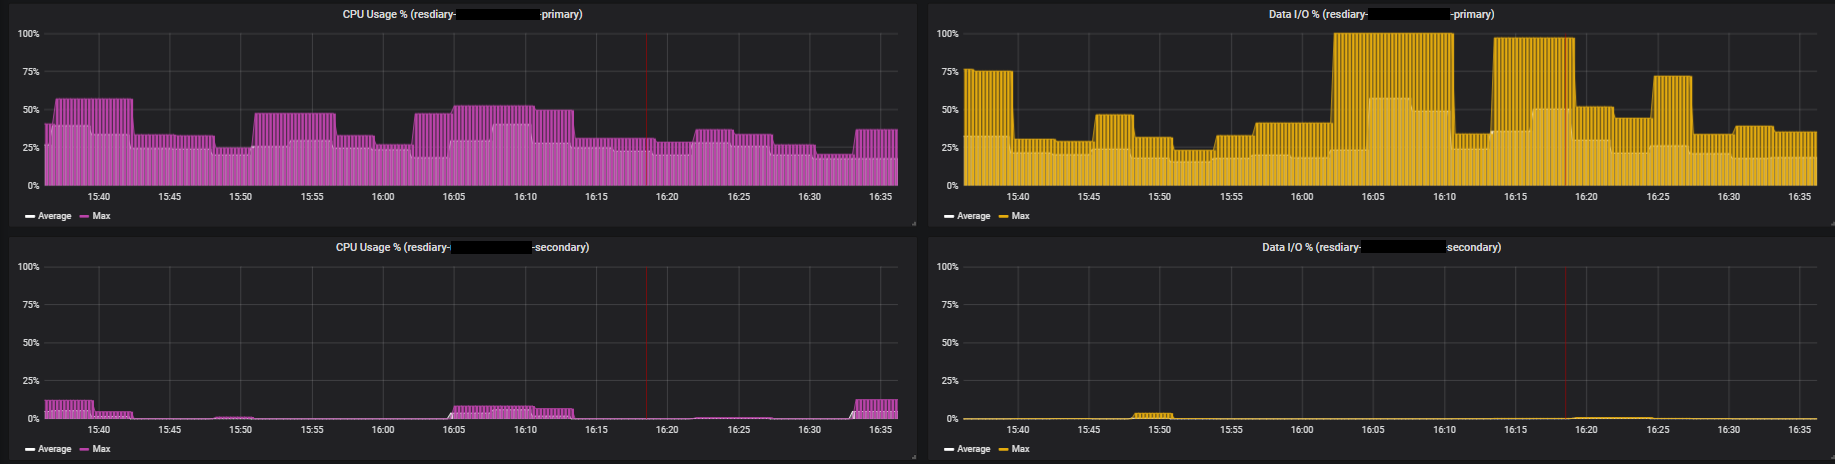
We make use of Azure SQL Failover Groups to provide redundancy in case of a problem with our primary databases. Our Grafana dashboard automatically duplicates the graphs for databases with secondaries so that we can see the stats for both databases together:
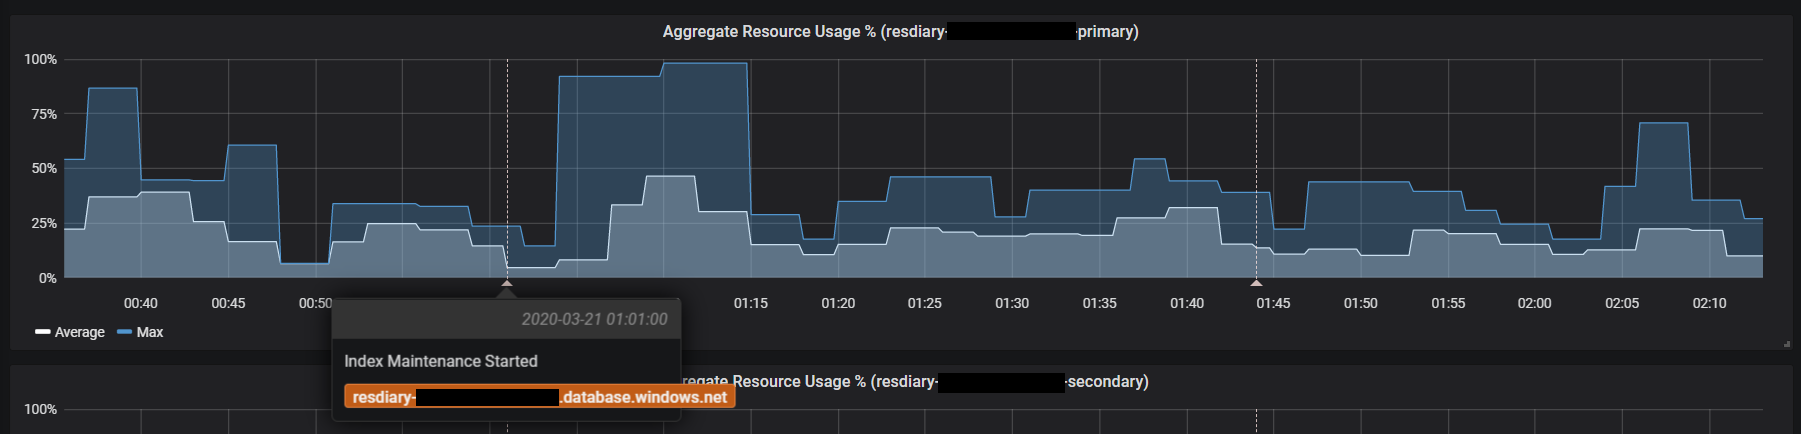
But where I think the possibilities of getting your Azure metrics into Prometheus really start to shine is the ability to combine them with metrics from other applications. For example, we have a tool that runs scheduled maintenance tasks against our databases. We’ve configured this tool to export a Prometheus metric indicating when the maintenance starts and finishes. This allows us to use Grafana annotations to display this on our SQL Dashboard:
You may have noticed that we have a metric called “ARU” or Aggregate Resource Usage displayed on our dashboard. If you take a look at the Azure Monitor documentation, you won’t find a metric by this name. Recently we began to switch some of our databases from the DTU model to the vCore model. While using the DTU model we had become used to using the DTU % metric to get an overall indication of the resource usage in our databases.
Unfortunately the vCore model doesn’t have a DTU metric, which caused our dashboards and alerts to break. After doing some research, we found that the DTU metric seems to be calculated as the max of the CPU %, Data I/O % and Log I/O % (see here).
Because we have each of these metrics in Prometheus, we were able to create a new common metric that we could use to track the overall resource usage of our databases, named ARU. We define this metric using a Prometheus recording rule, similar to the following:
- record: azure_sql_aru_percent_average
  expr: |
    max(azure_sql_cpu_percent_average or
      azure_sql_physical_data_read_percent_average or
      azure_sql_log_write_percent_average) by (resource_group, server, database)
NOTE: I’ve simplified the promql expression in the example above to make it easier to understand the concept. I didn’t want to go into too much technical detail in this post.
On a related note, this makes it really easy to write a Prometheus alert to notify us if the overall resource usage on any of our databases gets too high:
- alert: SQLDatabaseHighResourceUsage
  annotations:
    description: "The database '' on server ''
    in resource group '' has had a higher than normal CPU, Data I/O or
    Log I/O usage for at least 10 minutes.
    Please investigate.

      Runbook: https://github.com/.../runbooks/alert-runbooks/sql-database-high-resource-usage.md"
  expr: |
    max(azure_sql_aru_percent_average) by (resource_group, server, database) > 90
  for: 10m
  labels:
    dest: opsgenie
    severity: P1
Promitor Project
There are reasons other than just performance that makes Promitor attractive to us at ResDiary. The project is run by Tom Kerkhove, who is doing a great job at running a very professional open source project. Tom has been very quick to respond to issues and to offer assistance, and has been happy to accept contributions to the project. Promitor is also written in C# using .NET Core, which makes it familiar to us since we mainly use C# at ResDiary for our server side components.
Future improvements
Although in general we’ve had a pretty good experience of using Promitor, and it has solved the problem we needed it to, we have encountered a serious problem where it can end up opening too many file descriptors on the machine it’s running on, eventually causing resource starvation: https://github.com/tomkerkhove/promitor/issues/798. This problem seems to be caused by the underlying library that Promitor uses to make requests to the Azure Monitor API, Azure SDK for .NET. At the moment we are working around this by periodically restarting Promitor before it causes any issues, but obviously this isn’t ideal and it would be great if it could be fixed.
Other than that, the main pieces of functionality I’d like to see at the moment are:
- Adding Azure resource tags as metric labels: https://github.com/tomkerkhove/promitor/issues/599.
- Automatically discovering resources based on tags: https://github.com/tomkerkhove/promitor/issues/512.
The first item would make it easier for us to add metadata to our metrics like the application name, environment and region, which we could then include in our Grafana dashboards and alerts. The second item would mean that we could automatically get metrics for new resources as we spin them up without having to manually alter the Promitor configuration. This would be particularly useful to us because we spin up new test environments on demand to test out new features and bug fixes.
Hopefully that gives you an overview of what Promitor is, why you might want to use it, along with an idea of how we’re using it at ResDiary. Our experience with Promitor has been really positive so far, and it’s exciting to watch the project growing and improving.